


The Triangular Relationship among the US Dollar Index, Gold, and Oil
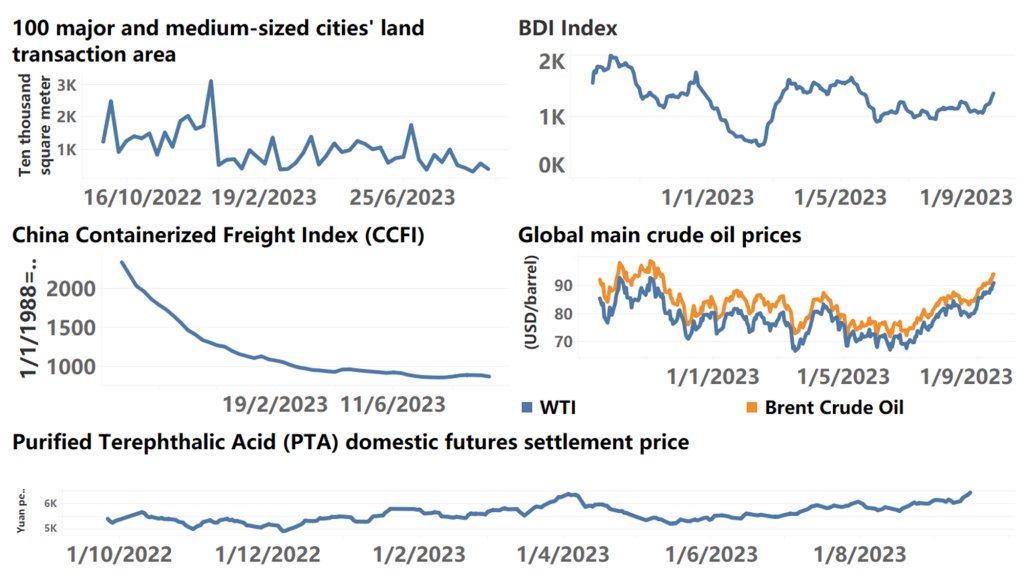
Since August 23, oil prices have risen sharply from $79 per barrel to $91 per barrel on September 15. The rapid rise in oil prices is primarily due to OPEC+ and Russia announcing production cuts to last until the end of the year, potentially leading to a severe supply shortage in the fourth quarter. The IEA stated in its monthly report that production cuts by Saudi Arabia and other OPEC members since January have reduced the daily market supply by 2.5 million barrels. However, this has largely been offset by record supplies from the United States, Iran, and Brazil. The IEA believes that due to OPEC+’s continued production cuts until the end of the year, the oil market may experience a significant daily supply gap of about 1.1 million barrels in the fourth quarter, which may support oil prices. Currently, Brent crude oil prices have risen to over $90 per barrel, the highest level in 10 months.
The U.S. dollar index rose from 99.7 on July 14th to 105.4 on September 15th, approaching the level of 105.7 on March 8, 2023. March 2023 was a period of great uncertainty for the U.S. economy’s hard landing and interest rate hike expectations, representing the peak of economic risk. Whether the U.S. dollar index can continue to rise is critical. Affected by the U.S. dollar index, gold prices are relatively weak. The New York Gold Association fluctuated from 2008 at the beginning of August to 1933 on September 15th, a significant drop from 2085 in early May 2023. Due to changes in the triangular relationship between the U.S. dollar, gold, and crude oil, the supply side of crude oil has become much stronger, with oil-producing countries seeking their own interests. The European Central Bank raised interest rates by 25 basis points this week. Although the Federal Reserve’s interest rate meeting hasn’t begun this week, the current market view is that the Fed will not raise interest rates in September, and the possibility of a rate hike in November is also low. Some voices in the market are already speculating on interest rate cut expectations. The upside potential for the U.S. dollar index is limited, but it may still rise further if inflation data exceeds expectations.
How to understand the US dollar index is key to subsequent investment decisions. Is there a trading logic to short the dollar and go long on the NASDAQ? The rationale for shorting the dollar is that it is now overbought. If the Federal Reserve pauses interest rate hikes this month and oil prices remain stable, one can short the dollar. Correspondingly, one can go long on the NASDAQ.
Furthermore, US inflation rose from 3.2% in July to 3.7% in August. The rise in CPI was mainly driven by energy prices and services, while core CPI fell from 4.7% to 4.3%. Two perspectives can support a relatively stable decline in US CPI:
- Consumption of services will end with the end of the holidays.
- Excess savings by US residents will be released in the fourth quarter, possibly cooling the demand side of the US economy in the fourth quarter. If the core inflation falls smoothly, the yield on US stocks may be very high.
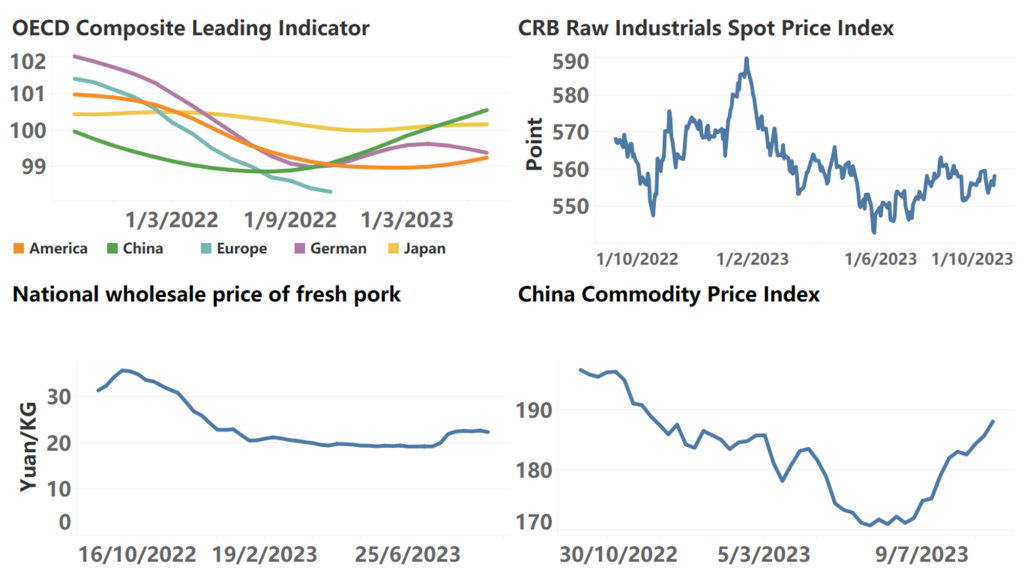
China’s Macroeconomic Perspective
Production has recovered, with growth rates roughly returning to June levels. Industrial production increased by 4.5% year-on-year in August (4.4% and 3.7% in June and July, respectively). The service production index increased by 6.8% year-on-year in August (6.8% and 5.7% in June and July, respectively), showing a significant marginal improvement compared to July. Boosted by the summer boom and a low base, consumer growth improved significantly. In August, total retail sales of consumer goods increased by 4.6% year-on-year, an improvement of 2.1 percentage points from July. Fixed asset investment increased slightly month-on-month. From January to August, fixed asset investment grew by 3.2% year-on-year (3.4% from January to July), with a corresponding monthly growth rate of 1.8% (1.2% in July). Manufacturing investment increased by 5.9% year-on-year cumulatively (5.7% from January to July), with a corresponding growth rate of 7.1% in August alone (4.3% in July). After excluding price factors, the actual growth rate of manufacturing investment also improved.
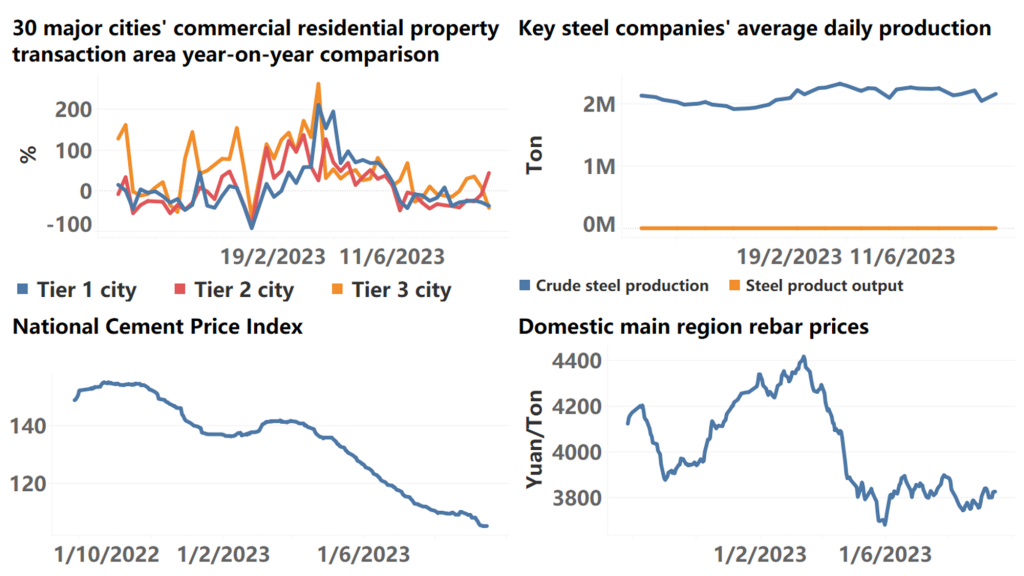
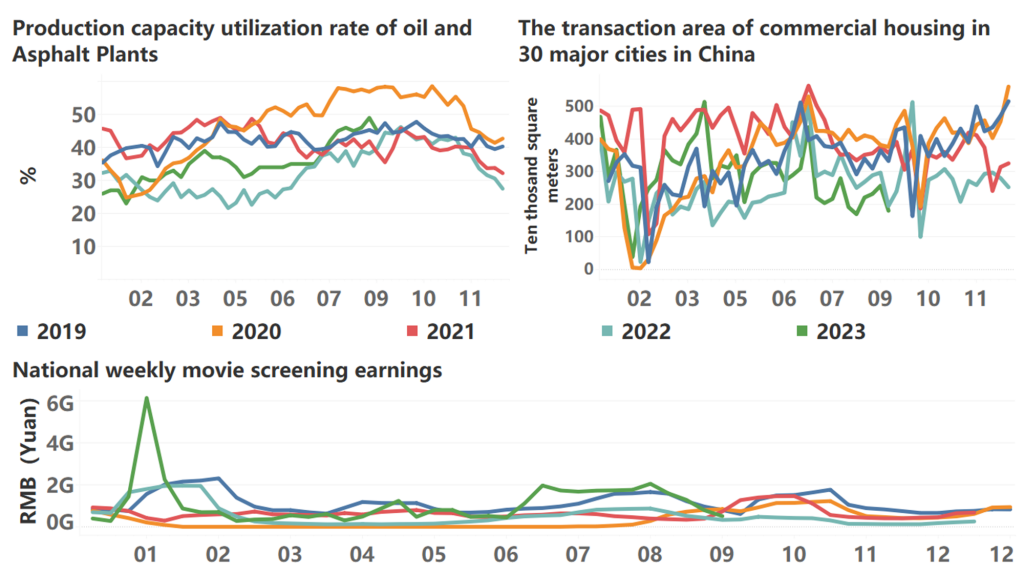
Real estate land acquisition, sales, and investment improved marginally. In August, the sales area and amount of new commercial housing increased year-on-year from -15.4% and -19.2% to -11.9% and -15.9%, respectively. The transaction volume of residential land in 300 cities increased year-on-year from -45% to -37%. New starts increased year-on-year from -25.7% to -22.1%. Completion remains high at 10.6%, and development investment increased year-on-year from -12.2% to -10.9%.
China’s economy, as shown by price data, financial data, and data from both the production and demand sides, stabilized in August. The accelerated issuance of special bonds, the reduction in reserve requirements, and the lifting of real estate purchase restrictions and other counter-cyclical regulatory policies were significantly strengthened in August. Currently, consumption and manufacturing investment are gradually overcoming previous panic sentiments, and real estate investment is still evolving towards a new equilibrium. The endogenous forces represented by retail sales and manufacturing investment are the key to the successful exit of counter-cyclical regulatory policies. This means that in the coming period, the issuance of special bonds, interest rate cuts, and monetary policy, along with retail sales and manufacturing investment, will need to complete the economic relay. It is expected that, influenced by external factors, counter-cyclical regulatory policies will likely continue until the first quarter of next year. If viewed on a six-month cycle, policy rollout may be gradual. However, in terms of monetary policy, interest rate cuts will be slow-paced, rolled out gradually at critical moments, achieving counter-cyclical regulation while stabilizing exchange rates and asset prices such as stocks.
In such a context over the next six months, China’s asset prices are expected to rise in the long run. However, the key now is how to overcome the panic phase, and the debt problem in real estate is still underwater and will continue to emerge gradually. One is the sentiment, and the other is the derivative of money, both of which will contract due to debt. But from a counter-cyclical regulatory perspective, adopting a loose monetary policy will not lead to a significant rise in asset prices such as stocks. On the contrary, it’s a good thing. The policy level can continue to intensify counter-cyclical adjustments while undertaking targeted structural reforms. Currently, August data is not enough for investors to be bullish. If September sees a continuous rebound in macro data, then the stock market sentiment will warm up on a large scale. The risk of the yuan’s excessive depreciation has passed.
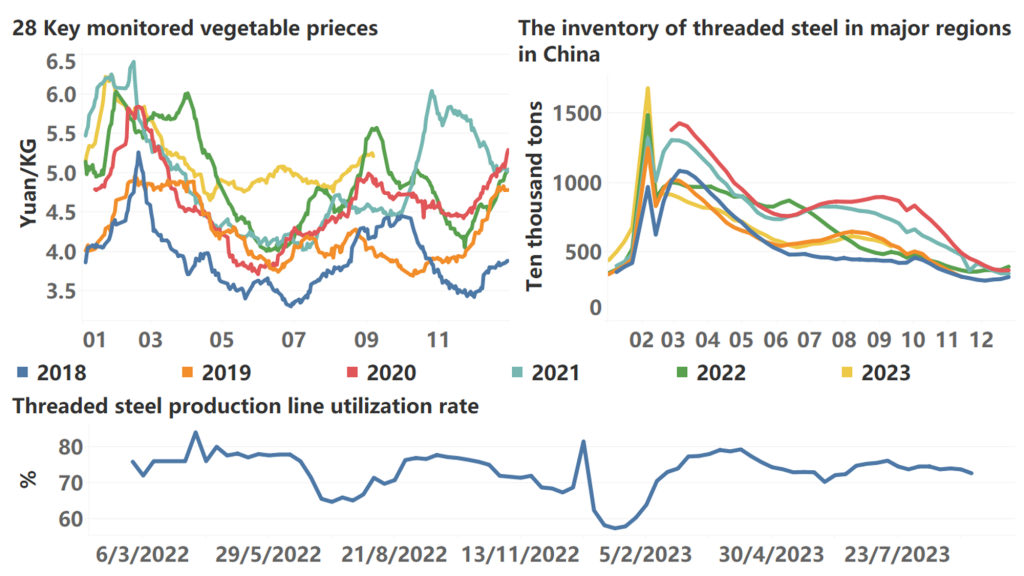
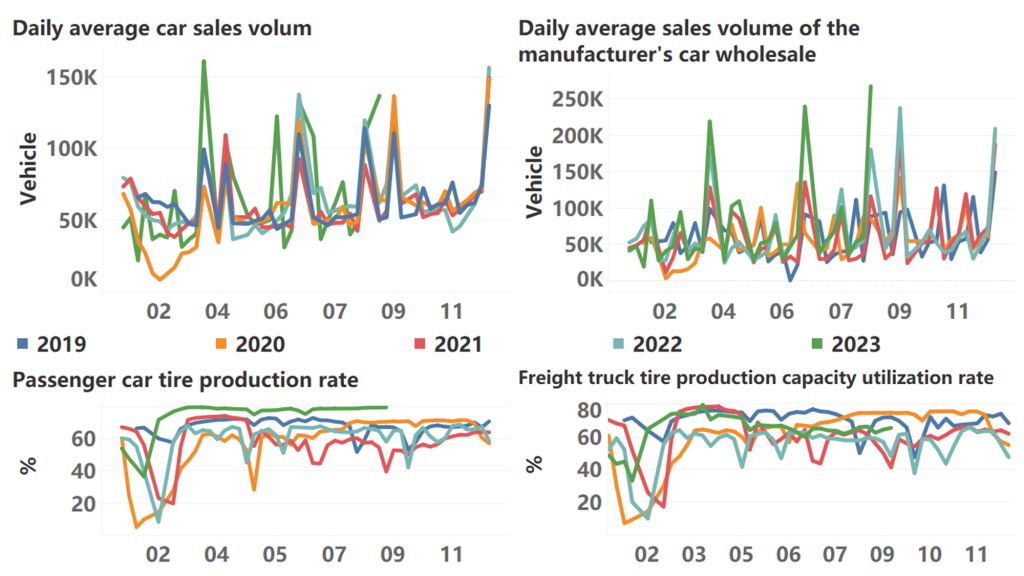
The following are high-frequency data for this week:
*Translated by ChatGPT