


X-Day
Grounded On June 3rd, U.S. President Biden signed a bill to suspend the national debt ceiling until January 1, 2025, to avoid the U.S. defaulting for the first time, mitigating the X-Day risk. Global capital markets generally rose last Friday with Japan’s Nikkei, Hong Kong’s Hang Seng, Shanghai, Europe, and the United States all experiencing increases. Comparatively, the Hang Seng Index was relatively low, while the Nikkei continued its upward trend, reaching a new historical high.
According to our judgment in Japan’s “New Normal”, the Nikkei has a lot of upward momentum before the cross of Japan’s CPI and the U.S. CPI. For the Hang Seng, its historically relative low position sends a negative signal to the market. It should be noted that the U.S. dollar index did not fall significantly with the landing of X-Day, and even continued to rise last weekend.
There are two possibilities for the U.S. Dollar Index:
- Decline: Affected by X-Day, the U.S. Dollar Index normally declines, financial institutions’ demand for U.S. Dollar liquidity weakens, and the U.S. Dollar Index gradually declines from 104 to 100. You can go long on Hang Seng, which has a larger relative return space.
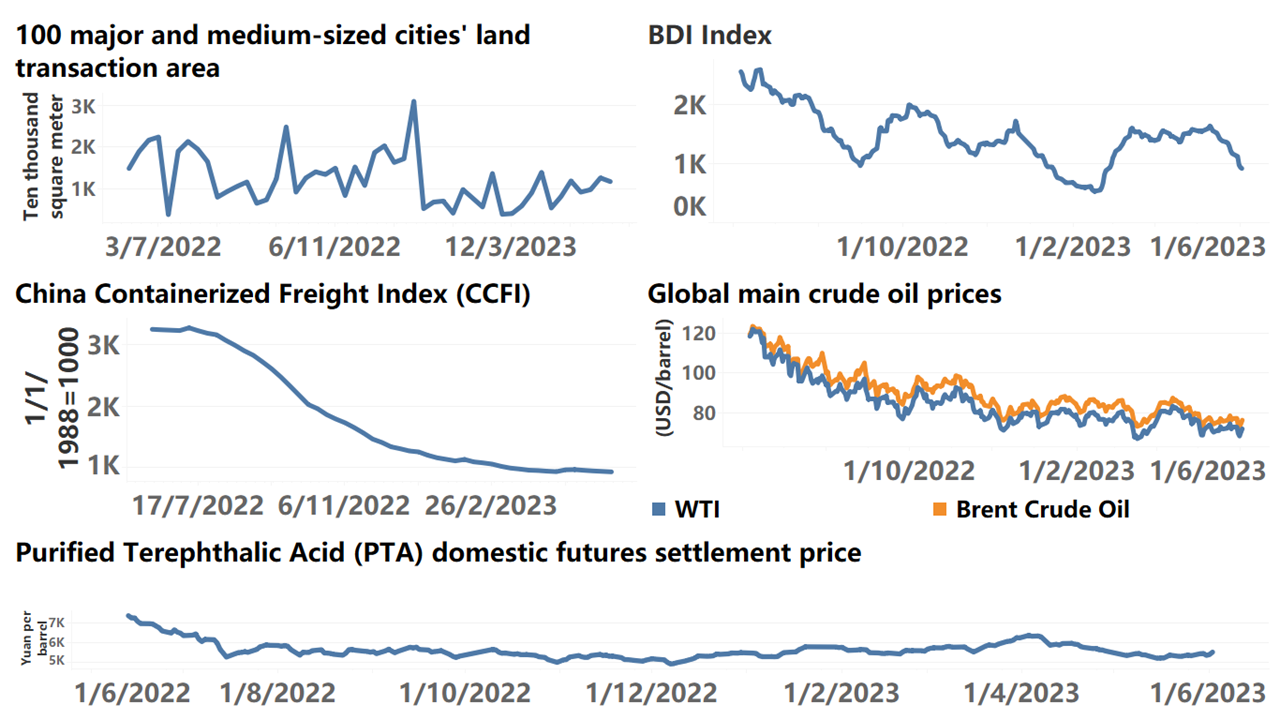
- No Decline: The expectation of rate hikes is strong, the U.S. economy has a soft landing, and the unexpected decline of Eurozone CPI gives the market confidence. This extends to a general judgment of crude oil prices. From the response of OPEC+ in the previous period, the price of $75 per barrel is the bottom line that OPEC+ member countries can bear. In Q3-Q4, there is a risk of OPEC+ continuing to reduce production to push up oil prices. This scenario does not support a high U.S. Dollar Index. In this case, you can go long on seasonal targets, such as tourism.
U.S. Unemployment Rate
The U.S. Department of Labor announced on the 2nd that the U.S. added 339,000 non-farm jobs in May, with an unemployment rate of 3.7%, up 0.3% from the previous month. At present, it cannot be determined whether the heat in the U.S. job market is diminishing, and the monthly change of 0.3% may be seasonal.
PMI
The manufacturing PMI in May fell slightly by 0.4% to 48.8% compared with last month, 1.8% lower than the seasonal low, and has fallen for three consecutive months; the construction industry fell to 58.2%, basically flat with the seasonality, and the service industry business activity index was 53.8%, down 1.3% from the previous month.
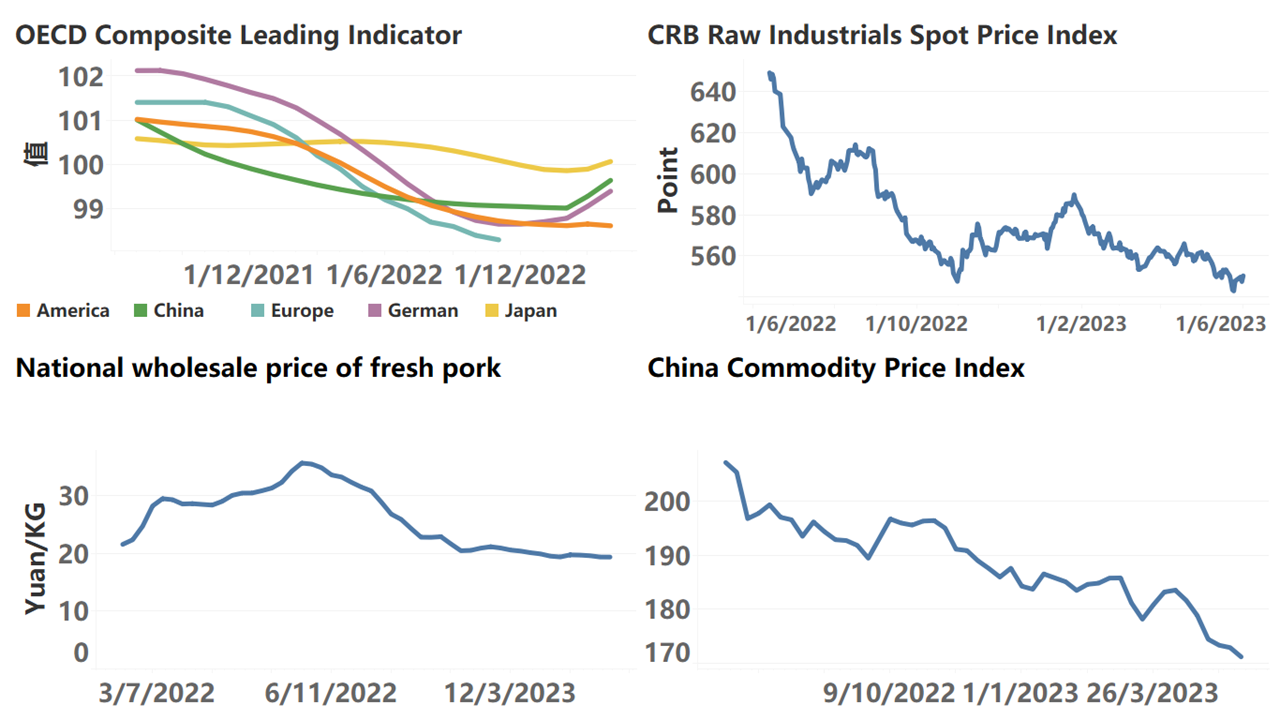
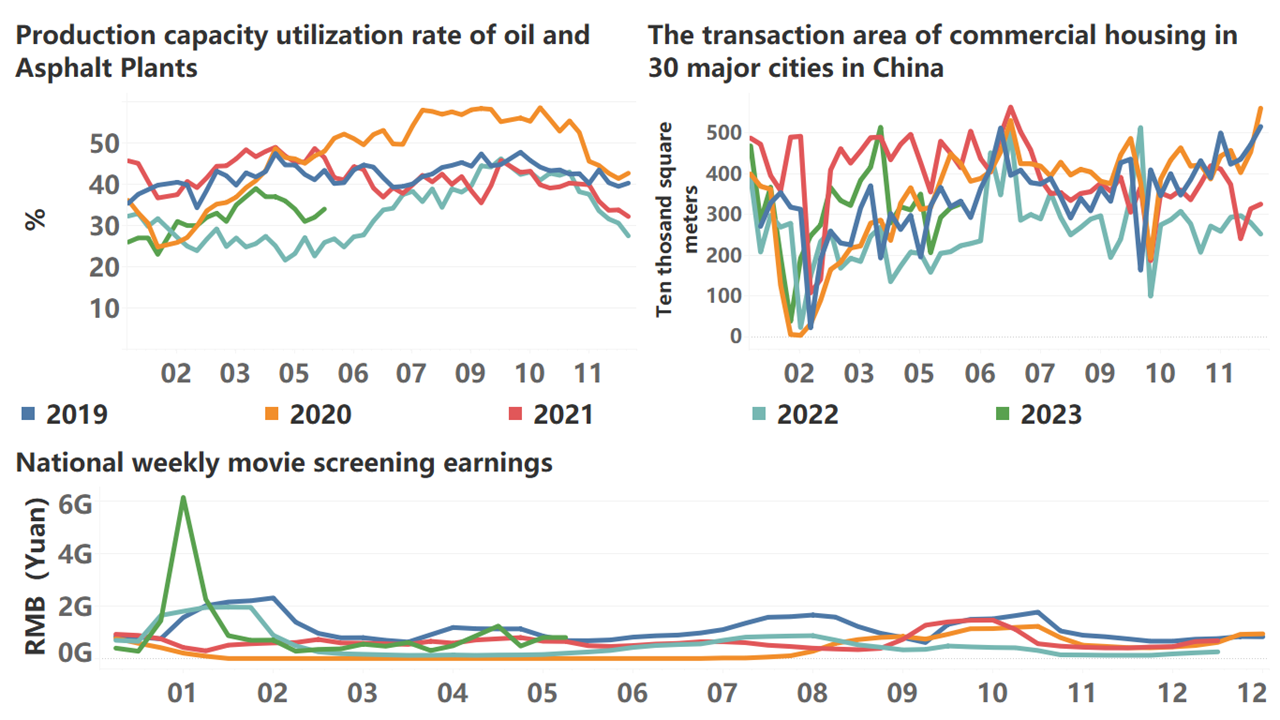
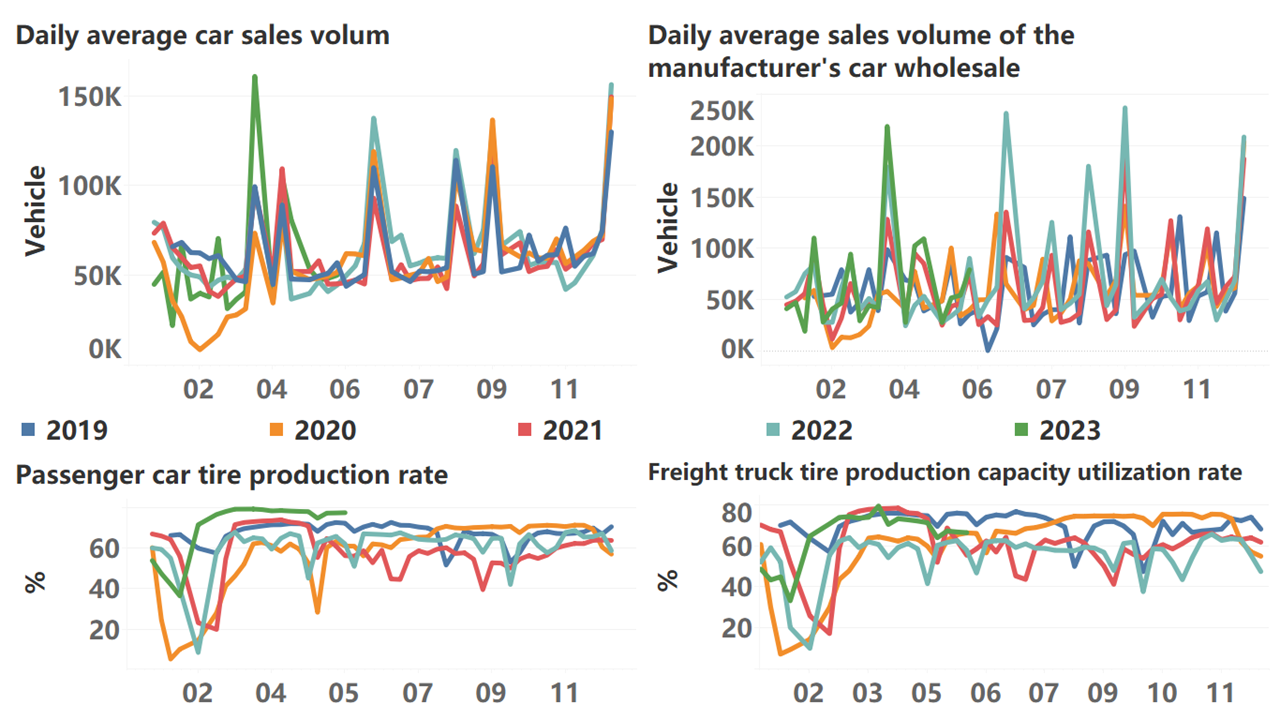
The continuous contraction of demand is the main reason why the manufacturing PMI has been below the boom-bust line for two consecutive months. In terms of bulk prices, the main contract of coking coal fell continuously from the closing of 2033.5 in early March to the closing of 1297 on June 5; the main contract of live pigs gradually fell from the closing of 17160 in early March to the closing of 15880 on June 2. The PMI factory price index fell from 48.7 in January to 41.6, and the overall market demand continued to be weak.
The manufacturing PMI being below the boom-bust line for two consecutive months has suppressed the overall trading enthusiasm of the stock market. Since mid-May, the trading volume of the Shanghai market has gradually declined and is currently at a low level, lacking support for the overall index. The representative sectors of domestic demand such as agriculture, automobiles, and wine have continued to decline, which reflects the market’s pricing of weak demand. It hasn’t threatened the overall liquidity of the RMB, in other words, the Shanghai market still has some support, but in the short term, if the PMI continues to decline, if it brings a contraction effect on the overall liquidity of the RMB, then the support of the Shanghai market will weaken. This is not a good signal for going long in the Shanghai market.
We reiterate that there is no self-healing process for the decline in PMI.
 *Translated by ChatGPT